 README
README


![]()
Glot
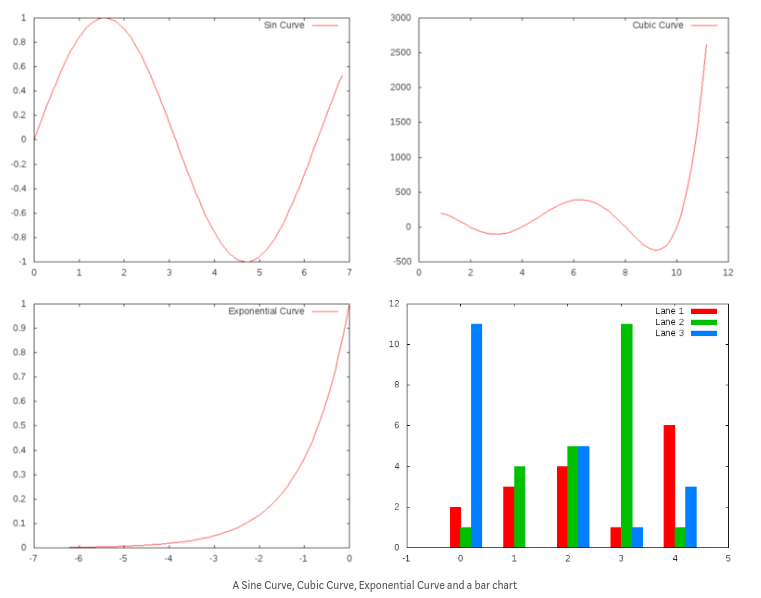
glot is a plotting library for Golang built on top of gnuplot. glot currently supports styles like lines, points, bars, steps, histogram, circle, and many others. We are continuously making efforts to add more features.
Documentation
Documentation is available at godoc.
Requirements
- gnu plot
- build gnu plot from source
- linux users
sudo apt-get updatesudo apt-get install gnuplot-x11
- mac users
- install homebrew
brew cask install xquartz(for x-11)brew install gnuplot --with-x11
Installation
go get github.com/Arafatk/glot
Usage and Examples
We have a blog post explaining our vision and covering some basic usage of the glot library. Check it out here.
Examples
Contributing
We really encourage developers coming in, finding a bug or requesting a new feature. Want to tell us about the feature you just implemented, just raise a pull request and we'll be happy to go through it. Please read the CONTRIBUTING and CODE_OF_CONDUCT file.
 Documentation
Documentation
Index 
- func SetCustomPathToGNUPlot(path string)
- type Func2d
- type Func3d
- type Plot
- func (plot *Plot) AddFunc2d(name string, style string, x []float64, fct Func2d) error
- func (plot *Plot) AddFunc3d(name string, style string, x []float64, y []float64, fct Func3d) error
- func (plot *Plot) AddPointGroup(name string, style string, data interface{}) (err error)
- func (plot *Plot) CheckedCmd(format string, a ...interface{})
- func (plot *Plot) Close() (err error)
- func (plot *Plot) Cmd(format string, a ...interface{}) error
- func (plot *Plot) RemovePointGroup(name string)
- func (plot *Plot) ResetPlot() (err error)
- func (plot *Plot) ResetPointGroupStyle(name string, style string) (err error)
- func (plot *Plot) SavePlot(filename string) (err error)
- func (plot *Plot) SetFormat(newformat string) error
- func (plot *Plot) SetLabels(labels ...string) error
- func (plot *Plot) SetLogscale(axis string, base int) error
- func (plot *Plot) SetTitle(title string) error
- func (plot *Plot) SetXLabel(label string) error
- func (plot *Plot) SetXrange(start int, end int) error
- func (plot *Plot) SetYLabel(label string) error
- func (plot *Plot) SetYrange(start int, end int) error
- func (plot *Plot) SetZLabel(label string) error
- func (plot *Plot) SetZrange(start int, end int) error
- type PointGroup
Constants 
This section is empty.
Variables 
This section is empty.
Functions 
func SetCustomPathToGNUPlot 
func SetCustomPathToGNUPlot(path string)
Types 
type Plot 
type Plot struct {
	PointGroup map[string]*PointGroup // A map between Curve name and curve type. This maps a name to a given curve in a plot. Only one curve with a given name exists in a plot.
	// contains filtered or unexported fields
}
Plot is the basic type representing a plot. Every plot has a set of Pointgroups that are simultaneously plotted on a 2/3 D plane given the plot type. The Plot dimensions must be specified at the time of construction and can't be changed later. All the Pointgroups added to a plot must have same dimensions as the dimension specified at the the time of plot construction. The Pointgroups can be dynamically added and removed from a plot And style changes can also be made dynamically.
func NewPlot 
NewPlot Function makes a new plot with the specified dimensions.
Usage
dimensions := 3
persist := false
debug := false
plot, _ := glot.NewPlot(dimensions, persist, debug)
Variable definitions
dimensions  :=> refers to the dimensions of the plot.
debug       :=> can be used by developers to check the actual commands sent to gnu plot.
persist     :=> used to make the gnu plot window stay open.
func (*Plot) AddFunc2d 
AddFunc2d is used to make a 2-d plot of the format y = Function(x)
Usage
dimensions := 2
persist := false
debug := false
plot, _ := glot.NewPlot(dimensions, persist, debug)
fct := func(x float64) float64 { return (math.Exp(x)) }
groupName := "Exponential Curve"
style := "lines"
pointsX := []float64{1, 2, 3, 4, 5}
plot.AddFunc2d(groupName, style, pointsX, fct)
plot.SavePlot("1.png")
Variable definitions
dimensions  :=> refers to the dimensions of the plot.
debug       :=> can be used by developers to check the actual commands sent to gnu plot.
persist     :=> used to make the gnu plot window stay open.
groupName   :=> Name of the curve
style       :=> Style of the curve
pointsX     :=> The x Value of the points to be plotted.  y = func(x) is plotted on the curve.
style       :=> Style of the curve
NOTE: Currently only float64 type is supported for this function
func (*Plot) AddFunc3d 
AddFunc3d is used to make a 3-d plot of the format z = Function(x,y)
Usage
dimensions := 3
persist := false
debug := false
plot, _ := glot.NewPlot(dimensions, persist, debug)
fct := func(x, y float64) float64 { return x - y }
groupName := "Stright Line"
style := "lines"
pointsY := []float64{1, 2, 3, 4, 5}
pointsX := []float64{1, 2, 3, 4, 5}
plot.AddFunc3d(groupName, style, pointsX, pointsY, fct)
plot.SetXrange(0, 5)
plot.SetYrange(0, 5)
plot.SetZrange(0, 5)
plot.SavePlot("1.png")
Variable definitions
dimensions  :=> refers to the dimensions of the plot.
debug       :=> can be used by developers to check the actual commands sent to gnu plot.
persist     :=> used to make the gnu plot window stay open.
groupName   :=> Name of the curve
style       :=> Style of the curve
pointsX     :=> The x Value of the points to be plotted.  y = func(x) is plotted on the curve.
NOTE: Currently only float64 type is supported for this function
func (*Plot) AddPointGroup 
AddPointGroup function adds a group of points to a plot.
Usage
dimensions := 2
persist := false
debug := false
plot, _ := glot.NewPlot(dimensions, persist, debug)
plot.AddPointGroup("Sample1", "points", []int32{51, 8, 4, 11})
plot.AddPointGroup("Sample2", "points", []int32{1, 2, 4, 11})
plot.SavePlot("1.png")
func (*Plot) CheckedCmd 
CheckedCmd is a convenience wrapper around Cmd: it will error if the error returned by Cmd isn't nil. ex:
fname := "foo.dat"
p.CheckedCmd("plot %s", fname)
func (*Plot) Close 
Close makes sure all resources used by the gnuplot subprocess are reclaimed. This method is typically called when the Plotter instance is not needed anymore. That's usually done via a defer statement:
p, err := gnuplot.NewPlotter(...)
if err != nil { /* handle error */ }
defer p.Close()
func (*Plot) Cmd 
Cmd sends a command to the gnuplot subprocess and returns an error if something bad happened in the gnuplot process. ex:
fname := "foo.dat"
err := p.Cmd("plot %s", fname)
if err != nil {
  panic(err)
}
func (*Plot) RemovePointGroup 
RemovePointGroup helps to remove a particular point group from the plot. This way you can remove a pointgroup if it's un-necessary.
Usage
dimensions := 3
persist := false
debug := false
plot, _ := glot.NewPlot(dimensions, persist, debug)
plot.AddPointGroup("Sample1", "points", []int32{51, 8, 4, 11})
plot.AddPointGroup("Sample2", "points", []int32{1, 2, 4, 11})
plot.RemovePointGroup("Sample1")
func (*Plot) ResetPlot 
ResetPlot is used to reset the whole plot. This removes all the PointGroup's from the plot and makes it new. Usage
plot.ResetPlot()
func (*Plot) ResetPointGroupStyle 
ResetPointGroupStyle helps to reset the style of a particular point group in a plot. Using both AddPointGroup and RemovePointGroup you can add or remove point groups. And dynamically change the plots.
Usage
dimensions := 2
persist := false
debug := false
plot, _ := glot.NewPlot(dimensions, persist, debug)
plot.AddPointGroup("Sample1", "points", []int32{51, 8, 4, 11})
plot.ResetPointGroupStyle("Sample1", "points")
func (*Plot) SavePlot 
SavePlot function is used to save the plot at this point. The plot is dynamic and additional pointgroups can be added and removed and different versions of the same plot can be saved.
Usage
 dimensions := 3
 persist := false
 debug := false
 plot, _ := glot.NewPlot(dimensions, persist, debug)
 plot.AddPointGroup("Sample 1", "lines", []float64{2, 3, 4, 1})
 plot.SetTitle("Test Results")
	plot.SetZrange(-2,2)
 plot.SavePlot("1.jpeg")
func (*Plot) SetFormat 
SetFormat function is used to save the plot at this point. The plot is dynamic and additional pointgroups can be added and removed and different versions of the same plot can be saved.
Usage
 dimensions := 3
 persist := false
 debug := false
 plot, _ := glot.NewPlot(dimensions, persist, debug)
 plot.AddPointGroup("Sample 1", "lines", []float64{2, 3, 4, 1})
 plot.SetTitle("Test Results")
	plot.SetFormat("pdf")
 plot.SavePlot("1.pdf")
NOTE: png is default format for saving files.
func (*Plot) SetLabels 
SetLabels Functions helps to set labels for x, y, z axis simultaneously
Usage
 dimensions := 3
 persist := false
 debug := false
 plot, _ := glot.NewPlot(dimensions, persist, debug)
 plot.AddPointGroup("Sample 1", "lines", []float64{2, 3, 4, 1})
 plot.SetTitle("Test Results")
	plot.SetLabels("X-axis","Y-Axis","Z-Axis")
func (*Plot) SetLogscale 
SetLogscale changes the label for the x-axis
Usage
dimensions := 3
persist := false
debug := false
plot, _ := glot.NewPlot(dimensions, persist, debug)
plot.SetYrange(-2, 18)
plot.AddPointGroup("rates", "circle", [][]float64{{2, 4, 8, 16, 32}, {4, 7, 4, 10, 3}})
plot.SetLogscale("x", 2)
func (*Plot) SetTitle 
SetTitle sets the title for the plot
Usage
dimensions := 3
persist := false
debug := false
plot, _ := glot.NewPlot(dimensions, persist, debug)
plot.AddPointGroup("Sample 1", "lines", []float64{2, 3, 4, 1})
plot.SetTitle("Test Results")
func (*Plot) SetXLabel 
SetXLabel changes the label for the x-axis
Usage
 dimensions := 3
 persist := false
 debug := false
 plot, _ := glot.NewPlot(dimensions, persist, debug)
 plot.AddPointGroup("Sample 1", "lines", []float64{2, 3, 4, 1})
 plot.SetTitle("Test Results")
	plot.SetXLabel("X-Axis")
func (*Plot) SetXrange 
SetXrange changes the label for the x-axis
Usage
 dimensions := 3
 persist := false
 debug := false
 plot, _ := glot.NewPlot(dimensions, persist, debug)
 plot.AddPointGroup("Sample 1", "lines", []float64{2, 3, 4, 1})
 plot.SetTitle("Test Results")
	plot.SetXrange(-2,2)
func (*Plot) SetYLabel 
SetYLabel changes the label for the y-axis
Usage
 dimensions := 3
 persist := false
 debug := false
 plot, _ := glot.NewPlot(dimensions, persist, debug)
 plot.AddPointGroup("Sample 1", "lines", []float64{2, 3, 4, 1})
 plot.SetTitle("Test Results")
	plot.SetYLabel("Y-Axis")
func (*Plot) SetYrange 
SetYrange changes the label for the y-axis
Usage
 dimensions := 3
 persist := false
 debug := false
 plot, _ := glot.NewPlot(dimensions, persist, debug)
 plot.AddPointGroup("Sample 1", "lines", []float64{2, 3, 4, 1})
 plot.SetTitle("Test Results")
	plot.SetYrange(-2,2)
func (*Plot) SetZLabel 
SetZLabel changes the label for the z-axis
Usage
 dimensions := 3
 persist := false
 debug := false
 plot, _ := glot.NewPlot(dimensions, persist, debug)
 plot.AddPointGroup("Sample 1", "lines", []float64{2, 3, 4, 1})
 plot.SetTitle("Test Results")
	plot.SetZLabel("Z-Axis")
type PointGroup 
type PointGroup struct {
	// contains filtered or unexported fields
}
A PointGroup refers to a set of points that need to plotted. It could either be a set of points or a function of co-ordinates. For Example z = Function(x,y)(3 Dimensional) or y = Function(x) (2-Dimensional)