 README
README
PI-Hole Prometheus Exporter
![]()

This is a Prometheus exporter for PI-Hole's Raspberry PI ad blocker.
Available Grafana Dasboards:
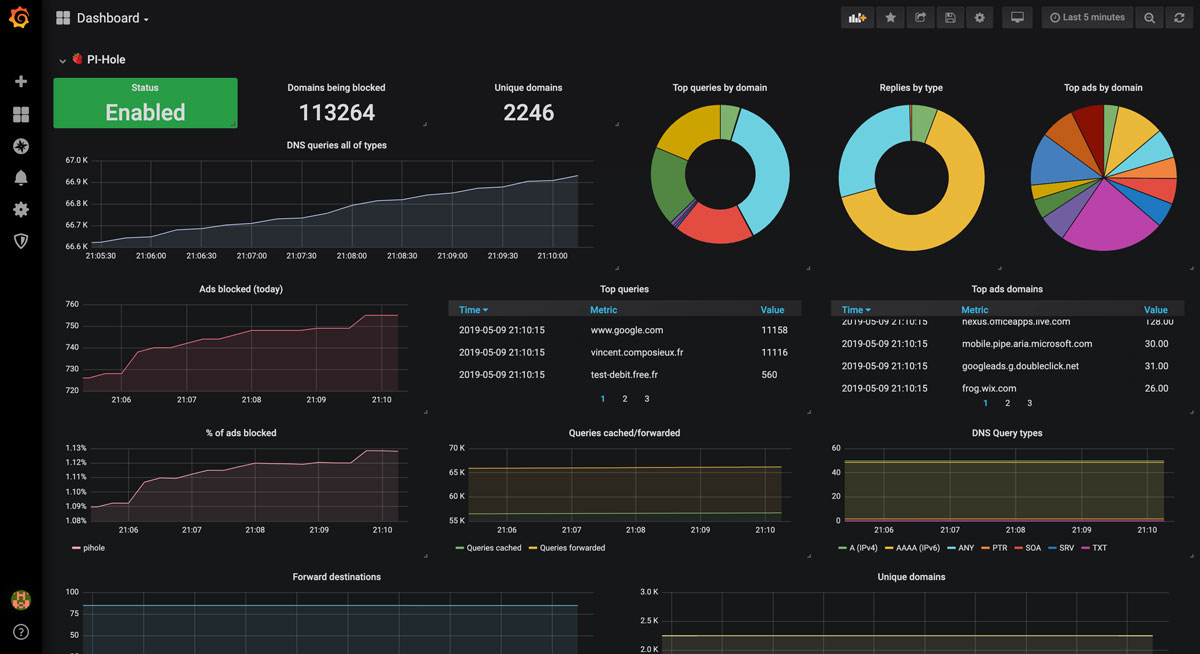
- Prometheus: Grafana Labs / JSON/Github --> Preview
- InfluxDB 2 (Flux): Grafana Labs / JSON/Github --> Preview
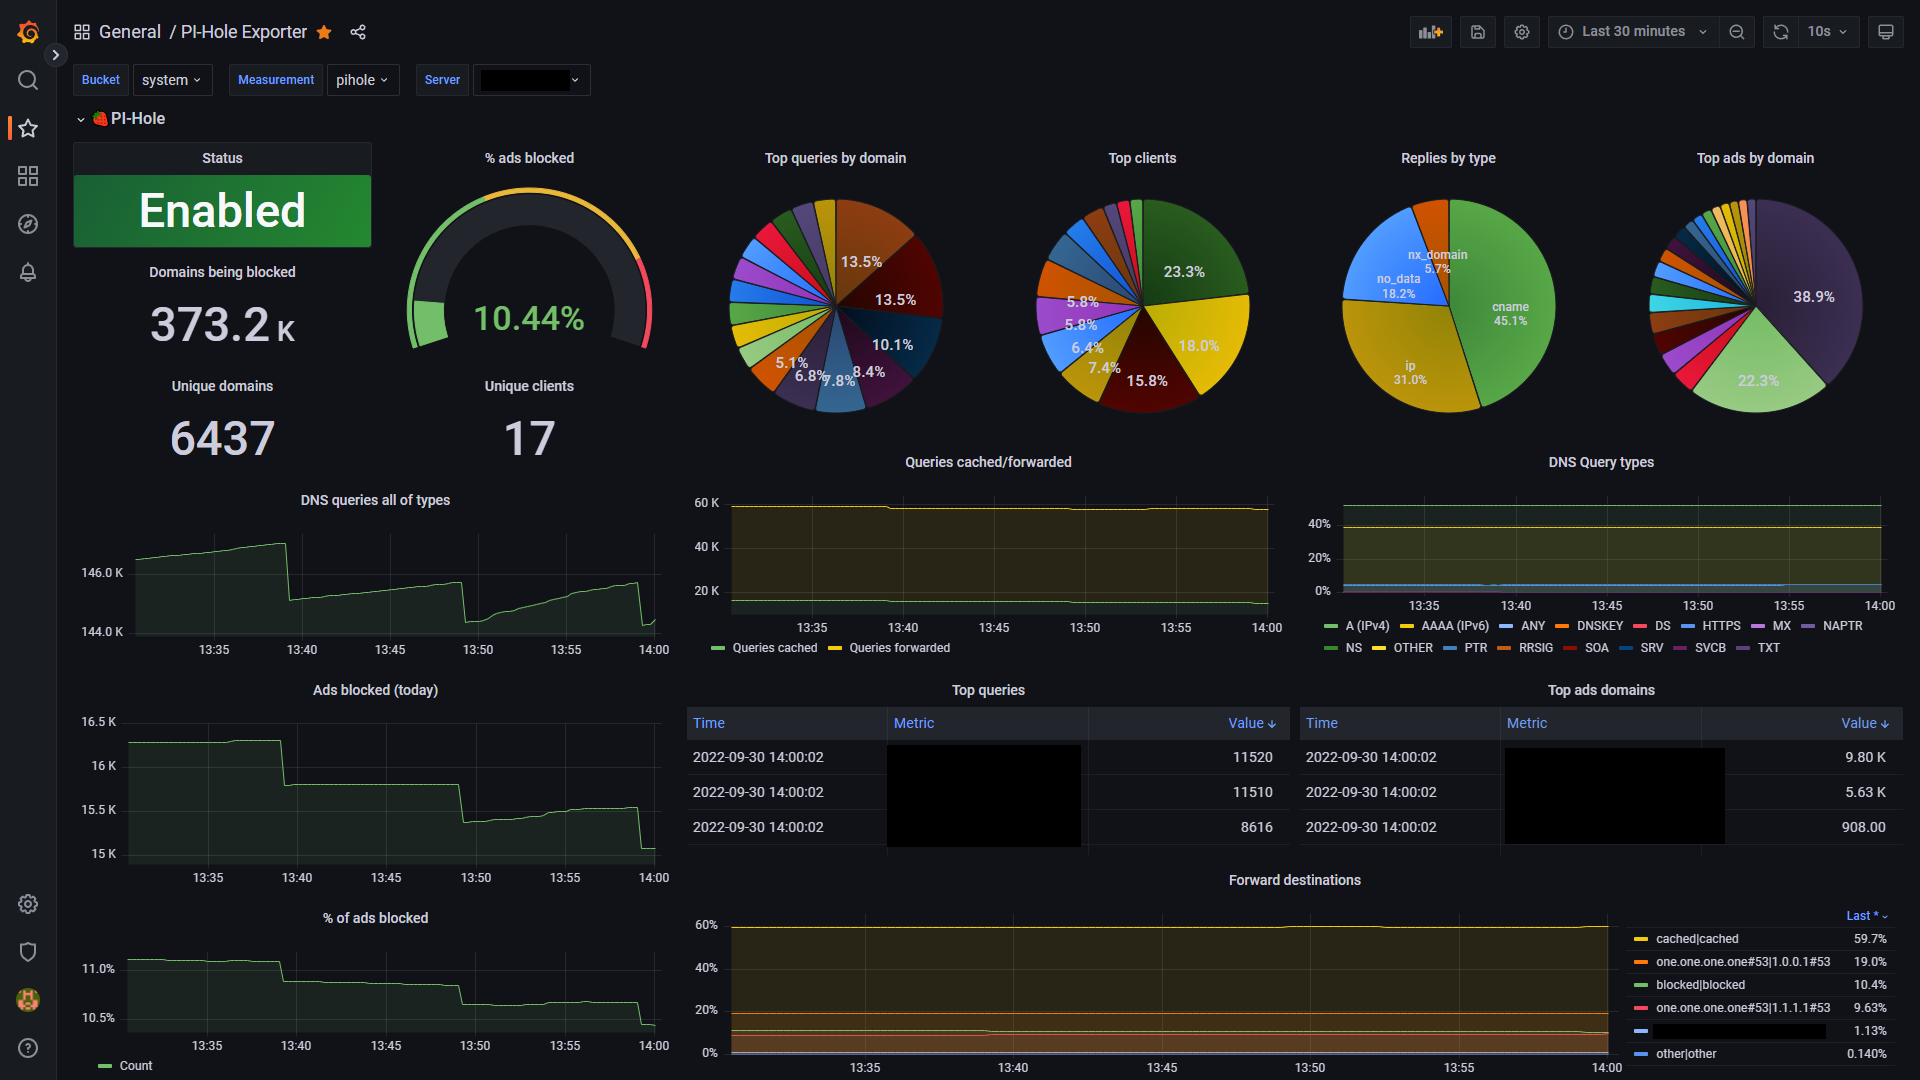
Prerequisites
Installation
Download binary
You can download the latest version of the binary built for your architecture here:
- Architecture i386 [ Linux / Windows ]
- Architecture amd64 [ Darwin / Linux / Windows ]
- Architecture arm [ Darwin / Linux ]
Using Docker
The exporter is also available as a Docker image. You can run it using the following example and pass configuration environment variables:
$ docker run \
  -e 'PIHOLE_HOSTNAME=192.168.1.2' \
  -e 'PIHOLE_PASSWORD=mypassword' \
  -e 'PORT=9617' \
  -p 9617:9617 \
  ekofr/pihole-exporter:latest
Or use PiHole's WEBPASSWORD as an API token instead of the password
$ API_TOKEN=$(awk -F= -v key="WEBPASSWORD" '$1==key {print $2}' /etc/pihole/setupVars.conf)
$ docker run \
  -e 'PIHOLE_HOSTNAME=192.168.1.2' \
  -e "PIHOLE_API_TOKEN=$API_TOKEN" \
  -e 'PORT=9617' \
  -p 9617:9617 \
  ekofr/pihole-exporter:latest
If you are running pi-hole behind https, you must both set the PIHOLE_PROTOCOL environment variable
as well as include your ssl certificates to the docker image as it does not have any baked in:
$ docker run \
  -e 'PIHOLE_PROTOCOL=https' \
  -e 'PIHOLE_HOSTNAME=192.168.1.2' \
  -e 'PIHOLE_PASSWORD=mypassword' \
  -e 'PORT=9617' \
  -v '/etc/ssl/certs:/etc/ssl/certs:ro' \
  -p 9617:9617 \
  ekofr/pihole-exporter:latest
A single instance of pihole-exporter can monitor multiple pi-holes instances. To do so, you can specify a list of hostnames, protocols, passwords/API tokens and ports by separating them with commas in their respective environment variable:
$ docker run \
  -e 'PIHOLE_PROTOCOL=http,http,http" \
  -e 'PIHOLE_HOSTNAME=192.168.1.2,192.168.1.3,192.168.1.4"' \
  -e "PIHOLE_API_TOKEN=$API_TOKEN1,$API_TOKEN2,$API_TOKEN3" \
  -e "PIHOLE_PORT=8080,8081,8080" \
  -e 'PORT=9617' \
  -p 9617:9617 \
  ekofr/pihole-exporter:latest
If port, protocol and API token/password is the same for all instances, you can specify them only once:
$ docker run \
  -e 'PIHOLE_PROTOCOL=,http" \
  -e 'PIHOLE_HOSTNAME=192.168.1.2,192.168.1.3,192.168.1.4"' \
  -e "PIHOLE_API_TOKEN=$API_TOKEN" \
  -e "PIHOLE_PORT=8080" \
  -e 'PORT=9617' \
  -p 9617:9617 \
  ekofr/pihole-exporter:latest
From sources
Optionally, you can download and build it from the sources. You have to retrieve the project sources by using one of the following way:
$ go install github.com/eko/pihole-exporter@latest
# or
$ git clone https://github.com/eko/pihole-exporter.git
Install the needed vendors:
$ GO111MODULE=on go mod vendor
Then, build the binary (here, an example to run on Raspberry PI ARM architecture):
$ GOOS=linux GOARCH=arm GOARM=7 go build -o pihole_exporter .
Usage
In order to run the exporter, type the following command (arguments are optional):
Using a password
$ ./pihole_exporter -pihole_hostname 192.168.1.10 -pihole_password azerty
Or use PiHole's WEBPASSWORD as an API token instead of the password
$ API_TOKEN=$(awk -F= -v key="WEBPASSWORD" '$1==key {print $2}' /etc/pihole/setupVars.conf)
$ ./pihole_exporter -pihole_hostname 192.168.1.10 -pihole_api_token $API_TOKEN
2019/05/09 20:19:52 ------------------------------------
2019/05/09 20:19:52 -  PI-Hole exporter configuration  -
2019/05/09 20:19:52 ------------------------------------
2019/05/09 20:19:52 PIHoleHostname : 192.168.1.10
2019/05/09 20:19:52 PIHolePassword : azerty
2019/05/09 20:19:52 Port : 9617
2019/05/09 20:19:52 Timeout : 5s
2019/05/09 20:19:52 ------------------------------------
2019/05/09 20:19:52 New Prometheus metric registered: domains_blocked
2019/05/09 20:19:52 New Prometheus metric registered: dns_queries_today
2019/05/09 20:19:52 New Prometheus metric registered: ads_blocked_today
2019/05/09 20:19:52 New Prometheus metric registered: ads_percentag_today
2019/05/09 20:19:52 New Prometheus metric registered: unique_domains
2019/05/09 20:19:52 New Prometheus metric registered: queries_forwarded
2019/05/09 20:19:52 New Prometheus metric registered: queries_cached
2019/05/09 20:19:52 New Prometheus metric registered: clients_ever_seen
2019/05/09 20:19:52 New Prometheus metric registered: unique_clients
2019/05/09 20:19:52 New Prometheus metric registered: dns_queries_all_types
2019/05/09 20:19:52 New Prometheus metric registered: reply
2019/05/09 20:19:52 New Prometheus metric registered: top_queries
2019/05/09 20:19:52 New Prometheus metric registered: top_ads
2019/05/09 20:19:52 New Prometheus metric registered: top_sources
2019/05/09 20:19:52 New Prometheus metric registered: forward_destinations
2019/05/09 20:19:52 New Prometheus metric registered: querytypes
2019/05/09 20:19:52 New Prometheus metric registered: status
2019/05/09 20:19:52 Starting HTTP server
2019/05/09 20:19:54 New tick of statistics: 648 ads blocked / 66796 total DNS querie
...
Once the exporter is running, you also have to update your prometheus.yml configuration to let it scrape the exporter:
scrape_configs:
  - job_name: 'pihole'
    static_configs:
      - targets: ['localhost:9617']
Available CLI options
# Hostname of the host(s) where PI-Hole is installed
  -pihole_hostname string (optional) (default "127.0.0.1")

# Password defined on the PI-Hole interface
  -pihole_password string (optional)

# Timeout to connect and retrieve data from a Pi-Hole instance
  -timeout duration (optional) (default 5s)

# WEBPASSWORD / api token defined on the PI-Hole interface at `/etc/pihole/setupVars.conf`
  -pihole_api_token string (optional)

# Port to be used for the exporter
  -port string (optional) (default "9617")
Available Prometheus metrics
| Metric name | Description |
|---|---|
| pihole_domains_being_blocked | This represent the number of domains being blocked |
| pihole_dns_queries_today | This represent the number of DNS queries made over the current day |
| pihole_ads_blocked_today | This represent the number of ads blocked over the current day |
| pihole_ads_percentage_today | This represent the percentage of ads blocked over the current day |
| pihole_unique_domains | This represent the number of unique domains seen |
| pihole_queries_forwarded | This represent the number of queries forwarded |
| pihole_queries_cached | This represent the number of queries cached |
| pihole_clients_ever_seen | This represent the number of clients ever seen |
| pihole_unique_clients | This represent the number of unique clients seen |
| pihole_dns_queries_all_types | This represent the number of DNS queries made for all types |
| pihole_reply | This represent the number of replies made for all types |
| pihole_top_queries | This represent the number of top queries made by PI-Hole by domain |
| pihole_top_ads | This represent the number of top ads made by PI-Hole by domain |
| pihole_top_sources | This represent the number of top sources requests made by PI-Hole by source host |
| pihole_forward_destinations | This represent the number of forward destinations requests made by PI-Hole by destination |
| pihole_querytypes | This represent the number of queries made by PI-Hole by type |
| pihole_status | This represent if PI-Hole is enabled |
Pihole-Exporter Helm Chart
This is a simple Helm Chart to deploy the exporter in a kubernetes cluster.
 Documentation
Documentation

There is no documentation for this package.