 README
README
asciigraph
![]()
![]()

![]()
![]()
Go package to make lightweight ASCII line graphs ╭┈╯.
Installation
go get -u github.com/guptarohit/asciigraph@latest
Usage
Basic graph
package main

import (
    "fmt"
    "github.com/guptarohit/asciigraph"
)

func main() {
    data := []float64{3, 4, 9, 6, 2, 4, 5, 8, 5, 10, 2, 7, 2, 5, 6}
    graph := asciigraph.Plot(data)

    fmt.Println(graph)
}
Running this example would render the following graph:
  10.00 ┤        ╭╮
   9.00 ┤ ╭╮     ││
   8.00 ┤ ││   ╭╮││
   7.00 ┤ ││   ││││╭╮
   6.00 ┤ │╰╮  ││││││ ╭
   5.00 ┤ │ │ ╭╯╰╯│││╭╯
   4.00 ┤╭╯ │╭╯   ││││
   3.00 ┼╯  ││    ││││
   2.00 ┤   ╰╯    ╰╯╰╯
Multiple Series
package main

import (
    "fmt"
    "github.com/guptarohit/asciigraph"
)

func main() {
	data := [][]float64{{0, 1, 2, 3, 3, 3, 2, 0}, {5, 4, 2, 1, 4, 6, 6}}
	graph := asciigraph.PlotMany(data)

	fmt.Println(graph)
}
Running this example would render the following graph:
 6.00 ┤    ╭─
 5.00 ┼╮   │
 4.00 ┤╰╮ ╭╯
 3.00 ┤ │╭│─╮
 2.00 ┤ ╰╮│ ╰╮
 1.00 ┤╭╯╰╯  │
 0.00 ┼╯     ╰
Colored graphs
package main
import (
"fmt"
"github.com/guptarohit/asciigraph"
)
func main() {
data := make([][]float64, 4)
for i := 0; i < 4; i++ {
for x := -20; x <= 20; x++ {
v := math.NaN()
if r := 20 - i; x >= -r && x <= r {
v = math.Sqrt(math.Pow(float64(r), 2)-math.Pow(float64(x), 2)) / 2
}
data[i] = append(data[i], v)
}
}
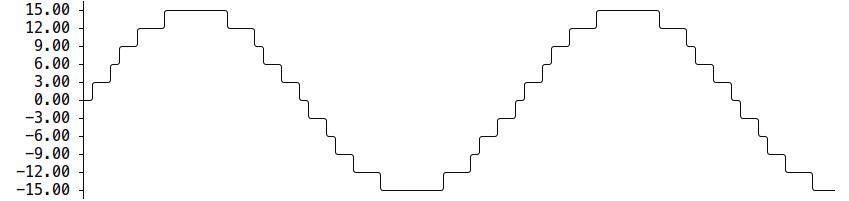
graph := asciigraph.PlotMany(data, asciigraph.Precision(0), asciigraph.SeriesColors(
asciigraph.Red,
asciigraph.Yellow,
asciigraph.Green,
asciigraph.Blue,
))
fmt.Println(graph)
}
Running this example would render the following graph:
Legends for colored graphs
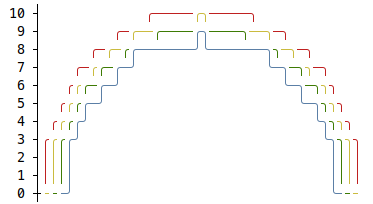
The graph can include legends for each series, making it easier to interpret.
package main

import (
	"fmt"
	"github.com/guptarohit/asciigraph"
	"math"
)

func main() {
	data := make([][]float64, 3)
	for i := 0; i < 3; i++ {
		for x := -12; x <= 12; x++ {
			v := math.NaN()
			if r := 12 - i; x >= -r && x <= r {
				v = math.Sqrt(math.Pow(float64(r), 2)-math.Pow(float64(x), 2)) / 2
			}
			data[i] = append(data[i], v)
		}
	}
	graph := asciigraph.PlotMany(data,
		asciigraph.Precision(0),
		asciigraph.SeriesColors(asciigraph.Red, asciigraph.Green, asciigraph.Blue),
		asciigraph.SeriesLegends("Red", "Green", "Blue"),
		asciigraph.Caption("Series with legends"))
	fmt.Println(graph)
}
Running this example would render the following graph:
CLI Installation
This package also brings a small utility for command line usage.
Assuming $GOPATH/bin is in your $PATH, install CLI with following command:
go install github.com/guptarohit/asciigraph/cmd/asciigraph@latest
or pull Docker image:
docker pull ghcr.io/guptarohit/asciigraph:latest
or download binaries from the releases page.
CLI Usage
> asciigraph --help
Usage of asciigraph:
  asciigraph [options]
Options:
  -ac axis color
    	y-axis color of the plot
  -b buffer
    	data points buffer when realtime graph enabled, default equal to `width`
  -c caption
    	caption for the graph
  -cc caption color
    	caption color of the plot
  -d delimiter
    	data delimiter for splitting data points in the input stream (default ",")
  -f fps
    	set fps to control how frequently graph to be rendered when realtime graph enabled (default 24)
  -h height
    	height in text rows, 0 for auto-scaling
  -lb lower bound
    	lower bound set the minimum value for the vertical axis (ignored if series contains lower values) (default +Inf)
  -lc label color
    	y-axis label color of the plot
  -o offset
    	offset in columns, for the label (default 3)
  -p precision
    	precision of data point labels along the y-axis (default 2)
  -r realtime
    	enables realtime graph for data stream
  -sc series colors
    	comma-separated series colors corresponding to each series
  -sl series legends
    	comma-separated series legends corresponding to each series
  -sn number of series
    	number of series (columns) in the input data (default 1)
  -ub upper bound
    	upper bound set the maximum value for the vertical axis (ignored if series contains larger values) (default -Inf)
  -w width
    	width in columns, 0 for auto-scaling
asciigraph expects data points from stdin. Invalid values are logged to stderr.
Feed it data points via stdin:
seq 1 72 | asciigraph -h 10 -c "plot data from stdin"
or use Docker image:
seq 1 72 | docker run -i --rm ghcr.io/guptarohit/asciigraph -h 10 -c "plot data from stdin"
Output:
 72.00 ┤                                                                  ╭────
 64.90 ┤                                                           ╭──────╯
 57.80 ┤                                                    ╭──────╯
 50.70 ┤                                             ╭──────╯
 43.60 ┤                                      ╭──────╯
 36.50 ┤                              ╭───────╯
 29.40 ┤                       ╭──────╯
 22.30 ┤                ╭──────╯
 15.20 ┤         ╭──────╯
  8.10 ┤  ╭──────╯
  1.00 ┼──╯
                                  plot data from stdin
Example of real-time graph for data points stream via stdin:

command for above graph
ping -i.2 google.com | grep -oP '(?<=time=).*(?=ms)' --line-buffered | asciigraph -r -h 10 -w 40 -c "realtime plot data (google ping in ms) from stdin"
Example of multi-series real-time graph for data points stream via stdin:

command for above graph
{unbuffer paste -d, <(ping -i 0.4 google.com | sed -u -n -E 's/.*time=(.*)ms.*/\1/p') <(ping -i 0.4 duckduckgo.com | sed -u -n -E 's/.*time=(.*)ms.*/\1/p') } | asciigraph -r -h 15 -w 60 -sn 2 -sc "blue,red" -c "Ping Latency Comparison" -sl "Google, DuckDuckGo"
Acknowledgement
This package started as golang port of asciichart.
Contributing
Feel free to make a pull request! :octocat:
 Documentation
Documentation
Index 
- Variables
- func Plot(series []float64, options ...Option) string
- func PlotMany(data [][]float64, options ...Option) string
- type AnsiColor
- type Option
- func AxisColor(ac AnsiColor) Option
- func Caption(caption string) Option
- func CaptionColor(ac AnsiColor) Option
- func Height(h int) Option
- func LabelColor(ac AnsiColor) Option
- func LowerBound(min float64) Option
- func Offset(o int) Option
- func Precision(p uint) Option
- func SeriesColors(ac ...AnsiColor) Option
- func SeriesLegends(text ...string) Option
- func UpperBound(max float64) Option
- func Width(w int) Option
Constants 
This section is empty.
Variables 
var Clear func()
clear terminal screen
var ColorNames = map[string]AnsiColor{}/* 141 elements not displayed */
Functions 
Types 
type AnsiColor ¶ added in v0.5.5
type AnsiColor byte
var ( Default AnsiColor = 0 AliceBlue AnsiColor = 255 AntiqueWhite AnsiColor = 255 Aqua AnsiColor = 14 Aquamarine AnsiColor = 122 Azure AnsiColor = 15 Beige AnsiColor = 230 Bisque AnsiColor = 224 Black AnsiColor = 188 // dummy value BlanchedAlmond AnsiColor = 230 Blue AnsiColor = 12 BlueViolet AnsiColor = 92 Brown AnsiColor = 88 BurlyWood AnsiColor = 180 CadetBlue AnsiColor = 73 Chartreuse AnsiColor = 118 Chocolate AnsiColor = 166 Coral AnsiColor = 209 CornflowerBlue AnsiColor = 68 Cornsilk AnsiColor = 230 Crimson AnsiColor = 161 Cyan AnsiColor = 14 DarkBlue AnsiColor = 18 DarkCyan AnsiColor = 30 DarkGoldenrod AnsiColor = 136 DarkGray AnsiColor = 248 DarkGreen AnsiColor = 22 DarkKhaki AnsiColor = 143 DarkMagenta AnsiColor = 90 DarkOliveGreen AnsiColor = 59 DarkOrange AnsiColor = 208 DarkOrchid AnsiColor = 134 DarkRed AnsiColor = 88 DarkSalmon AnsiColor = 173 DarkSeaGreen AnsiColor = 108 DarkSlateBlue AnsiColor = 60 DarkSlateGray AnsiColor = 238 DarkTurquoise AnsiColor = 44 DarkViolet AnsiColor = 92 DeepPink AnsiColor = 198 DeepSkyBlue AnsiColor = 39 DimGray AnsiColor = 242 DodgerBlue AnsiColor = 33 Firebrick AnsiColor = 124 FloralWhite AnsiColor = 15 ForestGreen AnsiColor = 28 Fuchsia AnsiColor = 13 Gainsboro AnsiColor = 253 GhostWhite AnsiColor = 15 Gold AnsiColor = 220 Goldenrod AnsiColor = 178 Gray AnsiColor = 8 Green AnsiColor = 2 GreenYellow AnsiColor = 155 Honeydew AnsiColor = 15 HotPink AnsiColor = 205 IndianRed AnsiColor = 167 Indigo AnsiColor = 54 Ivory AnsiColor = 15 Khaki AnsiColor = 222 Lavender AnsiColor = 254 LavenderBlush AnsiColor = 255 LawnGreen AnsiColor = 118 LemonChiffon AnsiColor = 230 LightBlue AnsiColor = 152 LightCoral AnsiColor = 210 LightCyan AnsiColor = 195 LightGoldenrodYellow AnsiColor = 230 LightGray AnsiColor = 252 LightGreen AnsiColor = 120 LightPink AnsiColor = 217 LightSalmon AnsiColor = 216 LightSeaGreen AnsiColor = 37 LightSkyBlue AnsiColor = 117 LightSlateGray AnsiColor = 103 LightSteelBlue AnsiColor = 152 LightYellow AnsiColor = 230 Lime AnsiColor = 10 LimeGreen AnsiColor = 77 Linen AnsiColor = 255 Magenta AnsiColor = 13 Maroon AnsiColor = 1 MediumAquamarine AnsiColor = 79 MediumBlue AnsiColor = 20 MediumOrchid AnsiColor = 134 MediumPurple AnsiColor = 98 MediumSeaGreen AnsiColor = 72 MediumSlateBlue AnsiColor = 99 MediumSpringGreen AnsiColor = 48 MediumTurquoise AnsiColor = 80 MediumVioletRed AnsiColor = 162 MidnightBlue AnsiColor = 17 MintCream AnsiColor = 15 MistyRose AnsiColor = 224 Moccasin AnsiColor = 223 OldLace AnsiColor = 230 Olive AnsiColor = 3 OliveDrab AnsiColor = 64 Orange AnsiColor = 214 OrangeRed AnsiColor = 202 Orchid AnsiColor = 170 PaleGoldenrod AnsiColor = 223 PaleGreen AnsiColor = 120 PaleTurquoise AnsiColor = 159 PaleVioletRed AnsiColor = 168 PapayaWhip AnsiColor = 230 PeachPuff AnsiColor = 223 Peru AnsiColor = 173 Pink AnsiColor = 218 Plum AnsiColor = 182 PowderBlue AnsiColor = 152 Purple AnsiColor = 5 Red AnsiColor = 9 RosyBrown AnsiColor = 138 RoyalBlue AnsiColor = 63 SaddleBrown AnsiColor = 94 Salmon AnsiColor = 210 SandyBrown AnsiColor = 215 SeaGreen AnsiColor = 29 SeaShell AnsiColor = 15 Sienna AnsiColor = 131 Silver AnsiColor = 7 SkyBlue AnsiColor = 117 SlateBlue AnsiColor = 62 SlateGray AnsiColor = 66 Snow AnsiColor = 15 SpringGreen AnsiColor = 48 SteelBlue AnsiColor = 67 Tan AnsiColor = 180 Teal AnsiColor = 6 Thistle AnsiColor = 182 Tomato AnsiColor = 203 Turquoise AnsiColor = 80 Violet AnsiColor = 213 Wheat AnsiColor = 223 White AnsiColor = 15 WhiteSmoke AnsiColor = 255 Yellow AnsiColor = 11 YellowGreen AnsiColor = 149 )
type Option ¶ added in v0.3.0
type Option interface {
	// contains filtered or unexported methods
}
Option represents a configuration setting.
func CaptionColor ¶ added in v0.5.5
CaptionColor sets the caption color.
func LabelColor ¶ added in v0.5.5
LabelColor sets the axis label color.
func LowerBound ¶ added in v0.5.6
LowerBound sets the graph's minimum value for the vertical axis. It will be ignored if the series contains a lower value.
func SeriesColors ¶ added in v0.5.5
SeriesColors sets the series colors.
func SeriesLegends ¶ added in v0.6.0
SeriesLegends sets the legend text for the corresponding series.
func UpperBound ¶ added in v0.5.6
UpperBound sets the graph's maximum value for the vertical axis. It will be ignored if the series contains a bigger value.