 README
README
CURdashboard
CURdashboard is an automated, extendable and configurable AWS customer usage report analyzer (CUR).
Use it to:
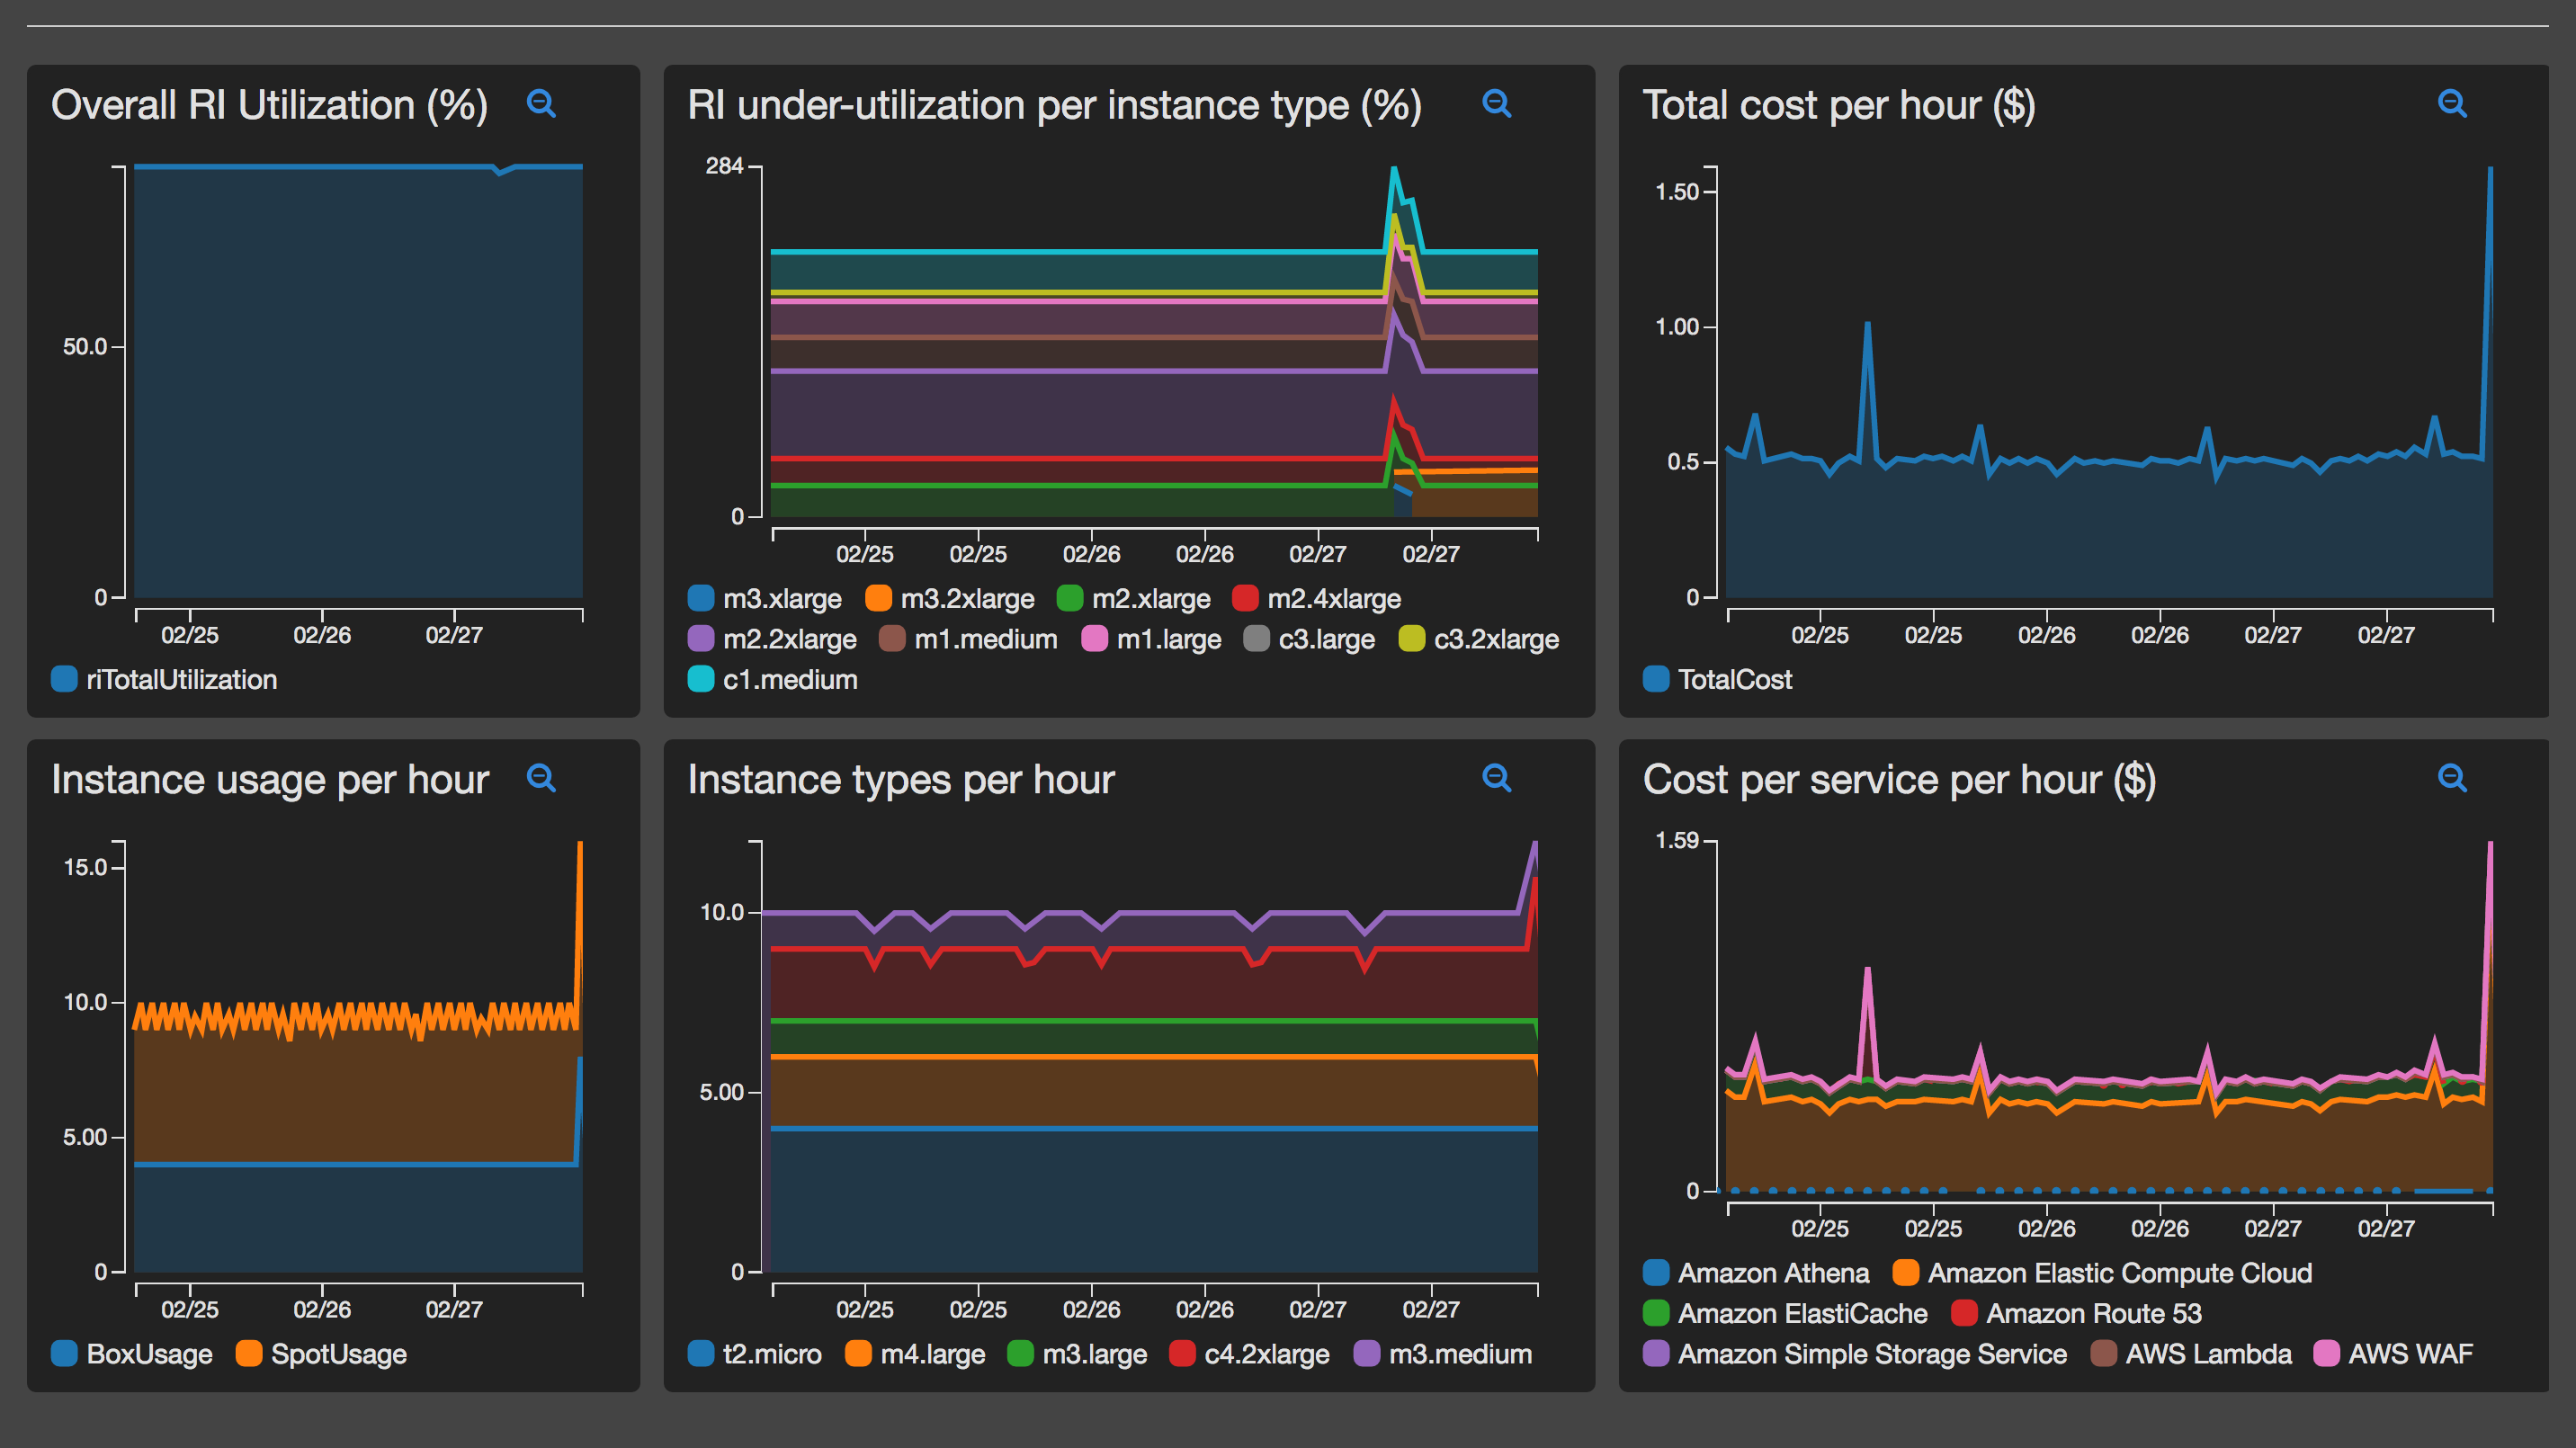
- Visualize your AWS costs via Cloudwatch dashboards
- Alert and react to spend changes within a few hours
- Build automation and alarming based on changes or cost thresholds.
- Gain insights into your AWS costs using simple SQL
CURdashboard automatically converts and queries the CUR. It produces cost metrics which are piped to AWS Cloudwatch to allow for dashboards to be produced and alarms/automation to be developed.
Metrics are generated by providing SQL queries which are executed using AWS Athena. A standard set of queries are provided, however the solution is designed to easly allow futher queries to be configured, so that metrics can be produced based on your needs and requirements.
CURDashboard also maintains a set of AWS Athena tables for you - to query your CUR as you wish. A table per month is created and kept upto date as new billing data is produced
How does this work?
AWS publishes customer usage records periodically during the day. These reports contain very detailed line-by-line billing details for every AWS charge related to your account.
CURdashboard sets up a AWS Autoscale Group configured to spin up a EC2 instance every N hours. This instance then bootstrap itself, converts the CSV based CUR reports into parquet format and re-uploads these converted files to S3. It then utilizes AWS Athena and standard SQL to create CUR tables within Athena and query specific billing metrics within them. The results of the queries are then reported to AWS Cloudwatch as custom metrics.
Once the metrics are in Cloudwatch, it is then very easy to:
- Graph metrics and create a billing Cloudwatch dashboard customized to your exact requirements.
- Produce alarms based on CUR metrics, which can then trigger alerting or automation via SNS.
In addition to querying the customer usage records. CURdashboard also queries any reserved instances on the account and then correlates them against actual usage to generate RI utilization metrics.
How much will this cost?
CURdashboard utilizes a number of cost-saving measures to minimize its cost.
For compute, EC2 spot instances are utilized. The instance will self-terminate after a few minutes of processing - hence will only be charged for the total time of processing, due to EC2 per-second billing.
AWS Athena charges on a per query and per data scanned basis. Parquet files greatly reduce the quantity of data that AWS Athena need to process, hence the costs of each query is reduced.
Each query/metric can be enabled or disabled so that only the metrics you need are ingested into Cloudwatch.
Overall costs will vary depending on the size of the Customer Usage Reports, the type of EC2 instance required and the number of metrics ingested into Cloudwatch.
It is expected compute, storage and query costs will be less that $1 per month.
[Insert Cloudwatch costs here]
Setup
Setup of CURdashboard should take ~15 minutes.
Step 1
If you have not already, turn on customer usage records in your AWS account, follow the instructions here
Please allow upto 24 hours for the CUR report to be generated and pushed into the configured S3 bucket before processing to step #2.
Step 2
Fork this GIT repo on Github.
The EC2 instance itself will bootstrap itself by cloning a configurable GIT repo and then run scripts and custom binaries to generate and upload the custom metrics.
This custom binary utilizes a configuration file which will need to be edited to enable/disable certain functionality and customize the metrics and queries that are run.
Therefore, forking this repo allow you to commit configuration modifications which will automatically come into effect the next time the EC2 instance spins up.
Step 3
Review file analyzeCUR.config to ensure the Metrics that are configured are applicable to your use-case. See below for the details on the configuration file format.
Note: Each metric can be configured to send either hourly, daily (or both) dimensions. Thus, dashboards can be generated showing costs per hour or per day.
Step 4
Using cloudformation bring up both stacks that are within the cf directory in your newly forked repo.
The network stack creates exports which are then referenced by the app stack. To be able to keep multiple stacks operational a ResourcePrefix is used which is pre-pended to the exports. The ResourcePrefix can be any text string but must be identical across both stacks.
cur_network.yaml is a CF template that will setup the VPC and general networking required. It is recomended to use a small CIDR block, as CURdownload will only ever spin-up a single EC2 instance.
cur_app.yaml is a CF template that sets up the required IAM EC2 role autoscale group with a configured time-based scale up policy. It is recommended to configure the schedule parameter to ~ 4-6 hours, as this is roughly how often the CUR report is updated by AWS.
Ensure you specify the GIT clone URL for your own repo. This will allow you to push configuration (or code) changes which will then be automatically picked up for the next time the EC2 instance spins up.
Step 5
Once setup you will need to wait for the first auto-scale spin-up to occur before metrics will be pushed into Cloudwatch.
To accelerate this up, you could also manually set the desired capacity of the ASG to 1 so that an instance will immediately spins up. It’s safe to leave this set to 1 as the instance will update the desired value back to zero (hence self-terminate) after it has finished processing.
Once the instance has spun up it will bootstrap itself and run the code to generate the custom metrics. These should start to appear in Cloudwatch, typically these appear within 15 minutes of instance start
Using the custom metrics, generate graphs that you would like and start creating your very own cost dashboard. Instructions on creating a Cloudwatch dashboard can be viewed here
Configuration
Configuration for CURdashboard is performed by editing the configuration file analyzeCUR.config.
The configuration file is in the TOML format and has a number of sections which are described below.
General Configuration options
These options are held within the [general] TOML section
| Option Name | Description | Default Value |
|---|---|---|
namespace |
The Cloudwatch namespace used for all metrics | CUR |
Athena Configuration options
These options are held within the [athena] TOML section
| ption Name | Description | Default Value |
|---|---|---|
database_name |
The database to create within Athena | CUR |
table_prefix |
The prefix used when creating the monthly CUR Athena tables. The current date will be appended to this in the format _MMYYYY |
autocur |
RI Configuration options
TBD
Metric Configuration
Each metric is held within a TOML array in the configuration file. This array is iterated over to query Athena and then send the results as metrics to Cloudwatch.
To add new metrics simply copy-and-paste an existing [[metric]] entry and then modify the various attributes, which are
| Metric Attribute | Description |
|---|---|
enabled |
Enables / Disables the metric |
hourly |
Enables / Disables hourly metric reporting |
daily |
Enables / Disables daily metric reporting |
type |
Reserved for future use. value of dimension-per-row is only accepted value currently |
cwName |
The metric name that will be sent to Cloudwatch |
cwDimension |
The dimension name that will be sent to Cloudwatch (the value of the dimension will be taken from the "dimension" row value (see below) |
cwType |
The cloudwatch metric type that will be sent to cloudwatch |
sql |
The SQL that will be executed on the Athena CUR table to fetch the metric information (see below) |
Athena Metric SQL
Each metric that you wish to display on the dashboard is obtained by querying the CUR Athena table. Each row that is returned is considered a new metric value. The date column is used as the time-series "divider" and is converted to a timestamp which is sent for this row.
Default useful metrics are pre-configured within the original configuration file. These can be disabled if required or even completely removed. New metrics can be added as described above.
CURdashboard uses a substitution parameter for the date column **INTERVAL**, this is used so that the same query can retrieve costs split by hour and day. It is recommended that the date column SQL always be:
substr("lineitem/usagestartdate",1,**INTERVAL**) as date
Each row in the query results MUST contain the following aliased columns
| Column Name | Description |
|---|---|
date |
the timeperiod for the metric. Typically the hour (format YYYY-MM-DD HH) or day |
value |
The metric value for this time period (normally a count(*) in SQL |
dimension |
The dimension value that will be sent for this row. |
For example, if a query returns a row with
date |
dimension |
value |
|---|---|---|
| 2017-02-01 17 | m3.xlarge | 50 |
Then a custom metric (named using the cwName parameter) will be sent to Cloudwatch as follows:
- The timestamp will be set to
2017-02-01 17:00:00 - The dimension name will be set to the parameter value
cwDimension - The dimension value will be set to
m3.xlarge - The value will be set to
50
Every row returned will send a metric using put-metric-data
Note. Athena uses Presto under-the-hood. Hence all Presto SQL functions are available for you to utilize. These can be found here.
Limitations
- Only RI's under the "running" account are fetched and used to generate % RI utilization. If RI's exist under linked accounts they are not currently included and will cause incorrect results. Temporary work around for this is to move all RI's into the payer account if possible.