 README
README
Examples
Choose a language folder to select an example for your language of choice.
How Pyroscope works
Pyroscope identifies performance issues in your application by continuously profiling the code.
If you've never used a profiler before, then welcome!
If you are familiar with profiling and flame graphs, then you'll be happy to know that Pyroscope:
- Requires very minimal overhead
- Can store years of perf data down to 10 second granularity
- Uses a unique, inverted flame graph for increased readability
Auto-instrumentation and language SDK instrumentation examples
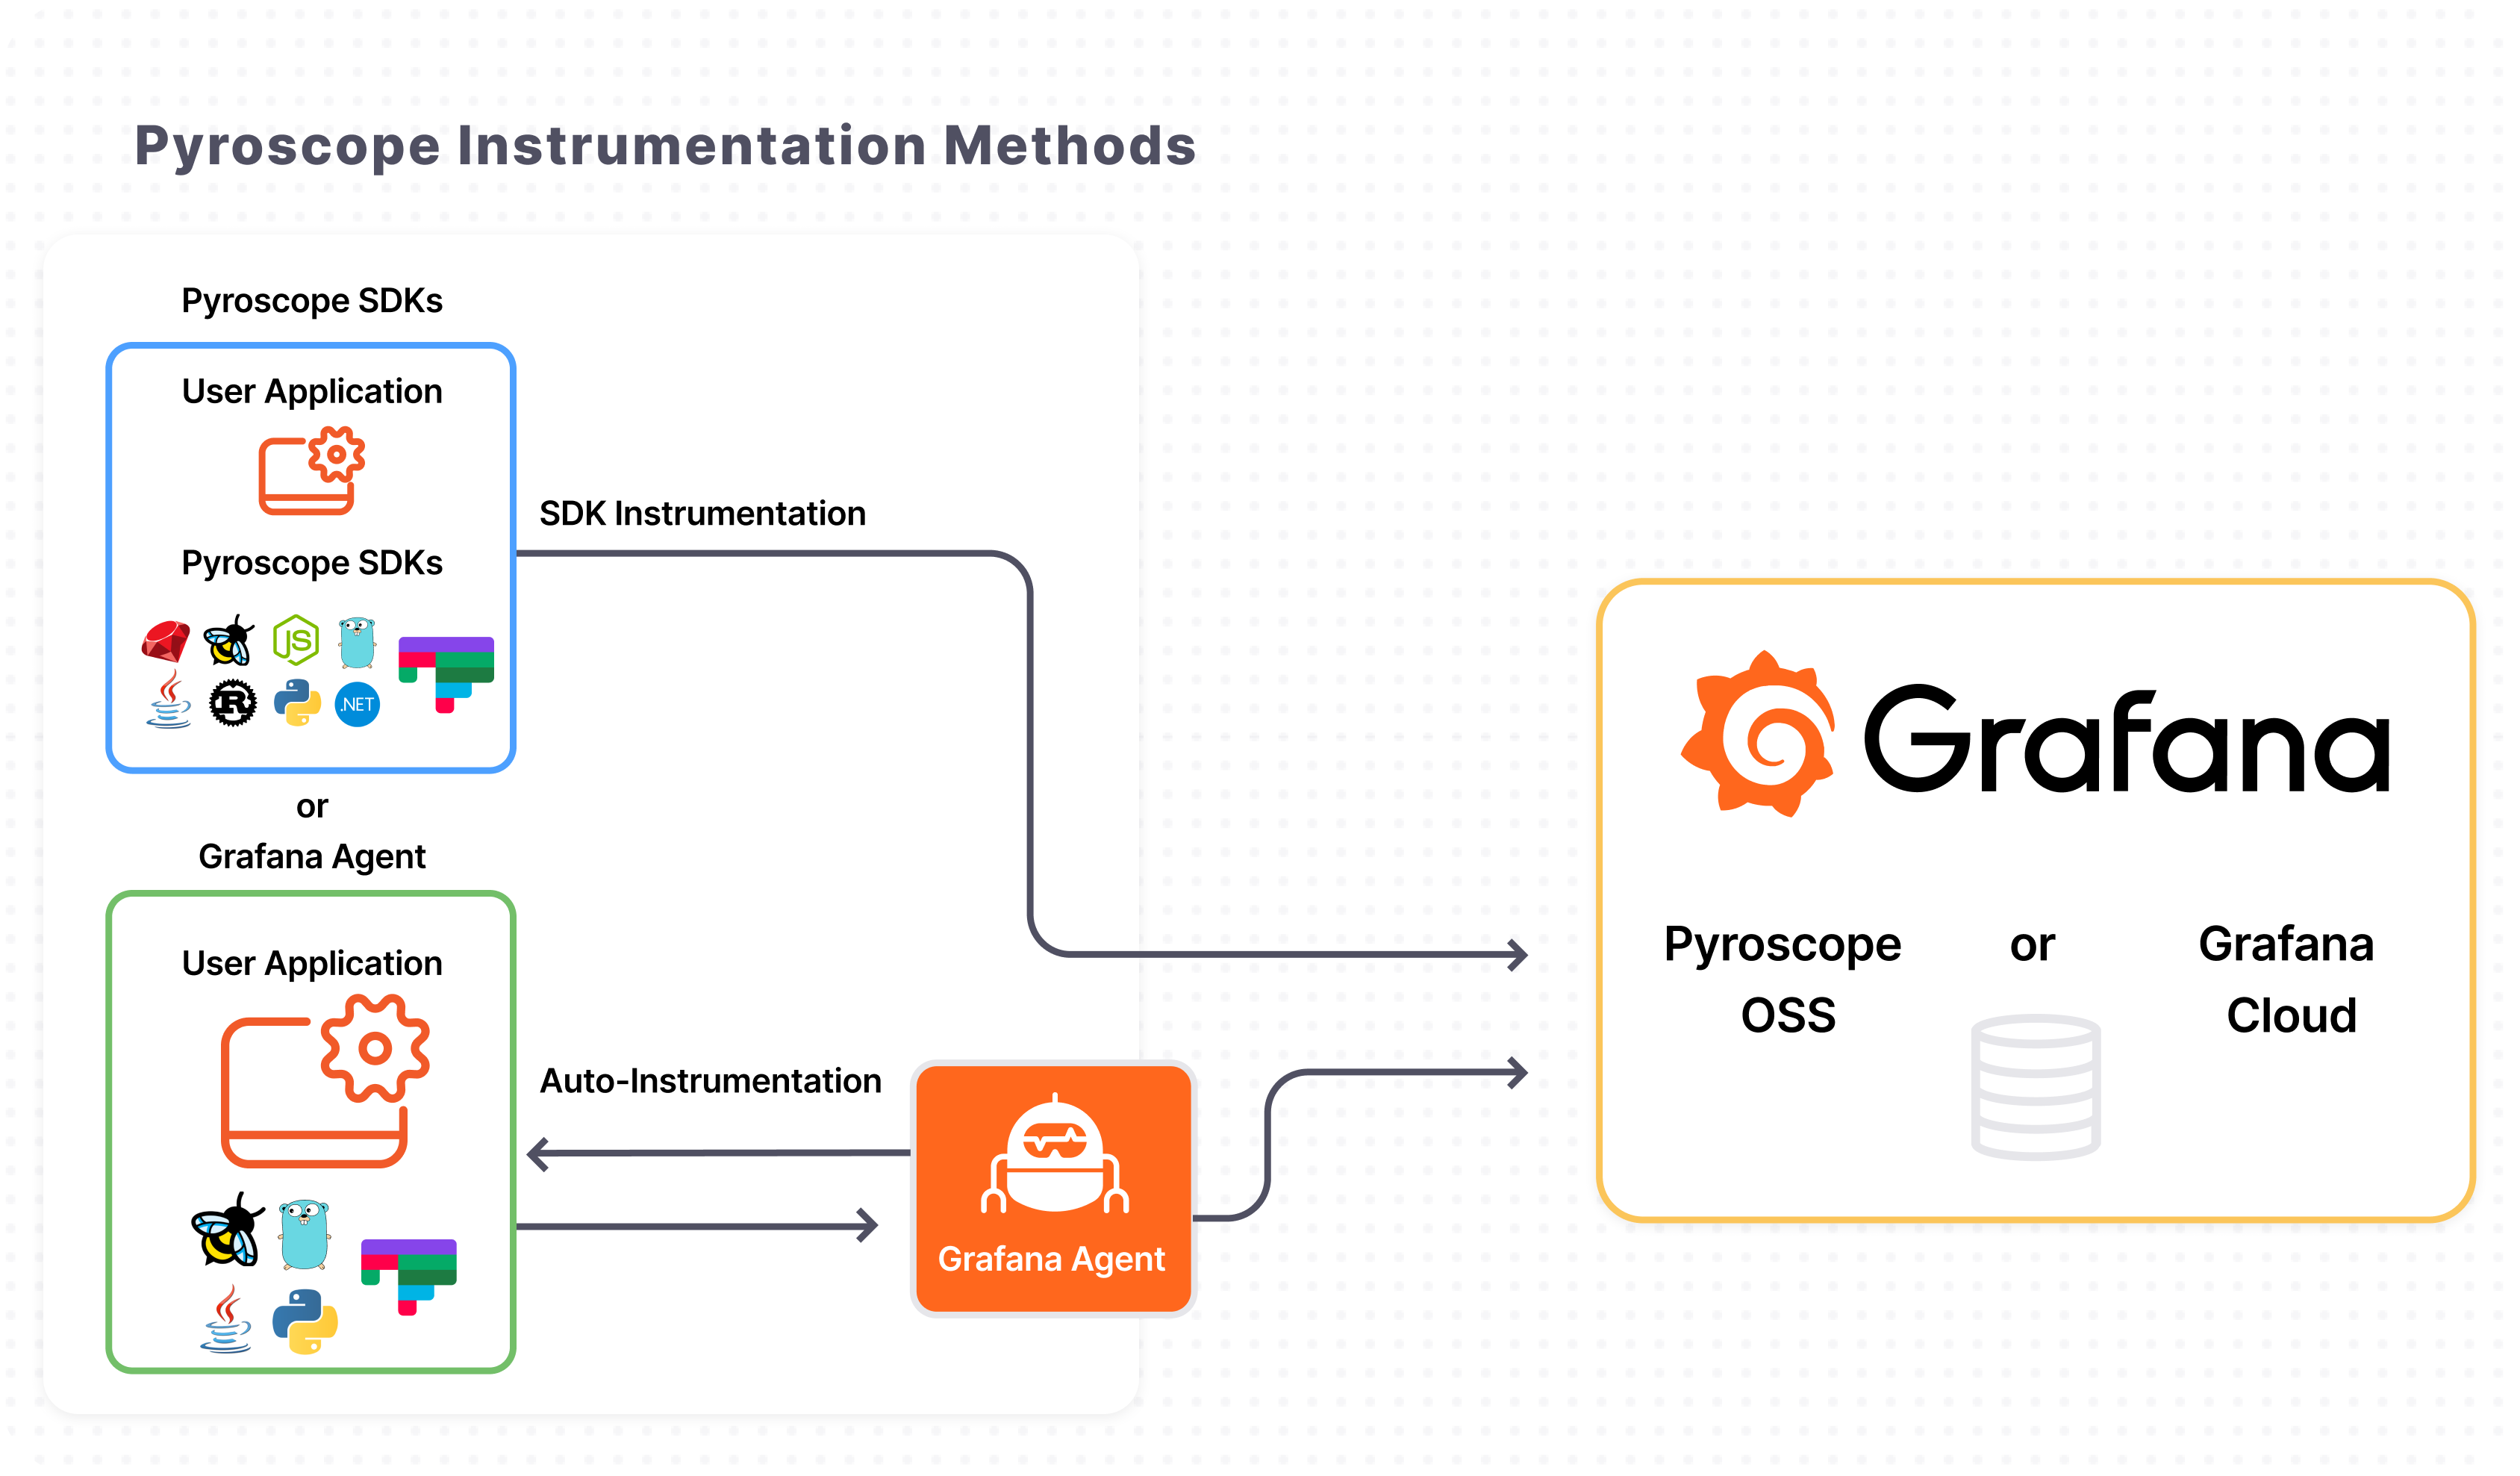
Pyroscope is a continuous profiling database that allows you to analyze the performance of your applications. When sending profiles to Pyroscope, you can choose between two primary methods: SDK Instrumentation and auto-instrumentation using the Grafana Agent.
About auto-instrumentation with Grafana Alloy or Agent collectors
You can send data from your application using Grafana Alloy or Grafana Agent collectors. Both collectors support profiling with eBPF, Java, and Golang in pull mode.
For examples using auto-instrumentation with the collectors, try the grafana-agent-auto-instrumentation example.
Grafana Alloy is a vendor-neutral distribution of the OpenTelemetry (OTel) Collector. Alloy uniquely combines the very best OSS observability signals in the community. Grafana Alloy uses configuration file written using River.
Alloy is the recommended collector instead of Grafana Agent. New installations should use Alloy.
Here's how it works:
- Install and configure the collector on the same machine or container where your application is running.
- The collector periodically retrieves your application's performance profiling data, regardless of the language or technology stack your application is using.
- The captured profiles are then sent to the Pyroscope server for storage and analysis.
Using a collector provides a hassle-free option, especially when dealing with multiple applications or microservices, allowing you to centralize the profiling process without changing your application's codebase.
About instrumentation with Pyroscope SDKs
Alternatively, Pyroscope SDKs offer you the ability to instrument your application directly for more precise profiling. Use the SDKs when you want complete control over the profiling process or when the application you are profiling is written in a language supported by the SDKs (for example, Java, Python, .NET, and others).
Here's how to use Pyroscope SDKs:
- Install the relevant Pyroscope SDK for your application's programming language (for example, pip package, npm package, Ruby gem).
- Instrument your application's code using the SDK to capture the necessary profiling data
- SDK automatically periodically pushes the captured profiles to the Pyroscope server for storage and analysis
By using the Pyroscope SDKs, you have the flexibility to customize the profiling process according to your application's specific requirements. You can selectively profile specific sections of code or send profiles at different intervals, depending on your needs.
Choose a Grafana collector or Pyroscope SDK to send profiles
You can use Grafana Alloy (recommended) or Grafana Agent (legacy) collectors for auto-instrumentation or the Pyroscope instrumentation SDKs. The method you choose depends on your specific use case and requirements.
Here are some factors to consider when making the choice:
- Ease of setup: The Grafana Alloy/Agent collector is an ideal choice for a quick and straightforward setup without modifying your application's code. Note that eBPF profiling supports some languages (for example, Golang) better than others. More robust support for Python, Java, and other languages are in development.
- Language support: If you want more control over the profiling process and your application is written in a language supported by the Pyroscope SDKs, consider using the SDKs.
- Flexibility: The Pyroscope SDKs offer greater flexibility in terms of customizing the profiling process and capturing specific sections of code with labels. If you have particular profiling needs or want to fine-tune the data collection process, the SDKs would be your best bet.
To get started, choose one of the integrations below:


Enriching profile data
You can add tags to your profiles to help correlate them with your other telemetry signals. Some common tags that are used are version, region, environment, request types, etc. You have the ability to add tags using both the SDK and the agent.
Valid tag formats may contain ASCII letters and digits, as well as underscores. It must match the regex [a-zA-Z_][a-zA-Z0-9_].
In Pyroscope, a period (.) is not a valid character inside of tags and labels.